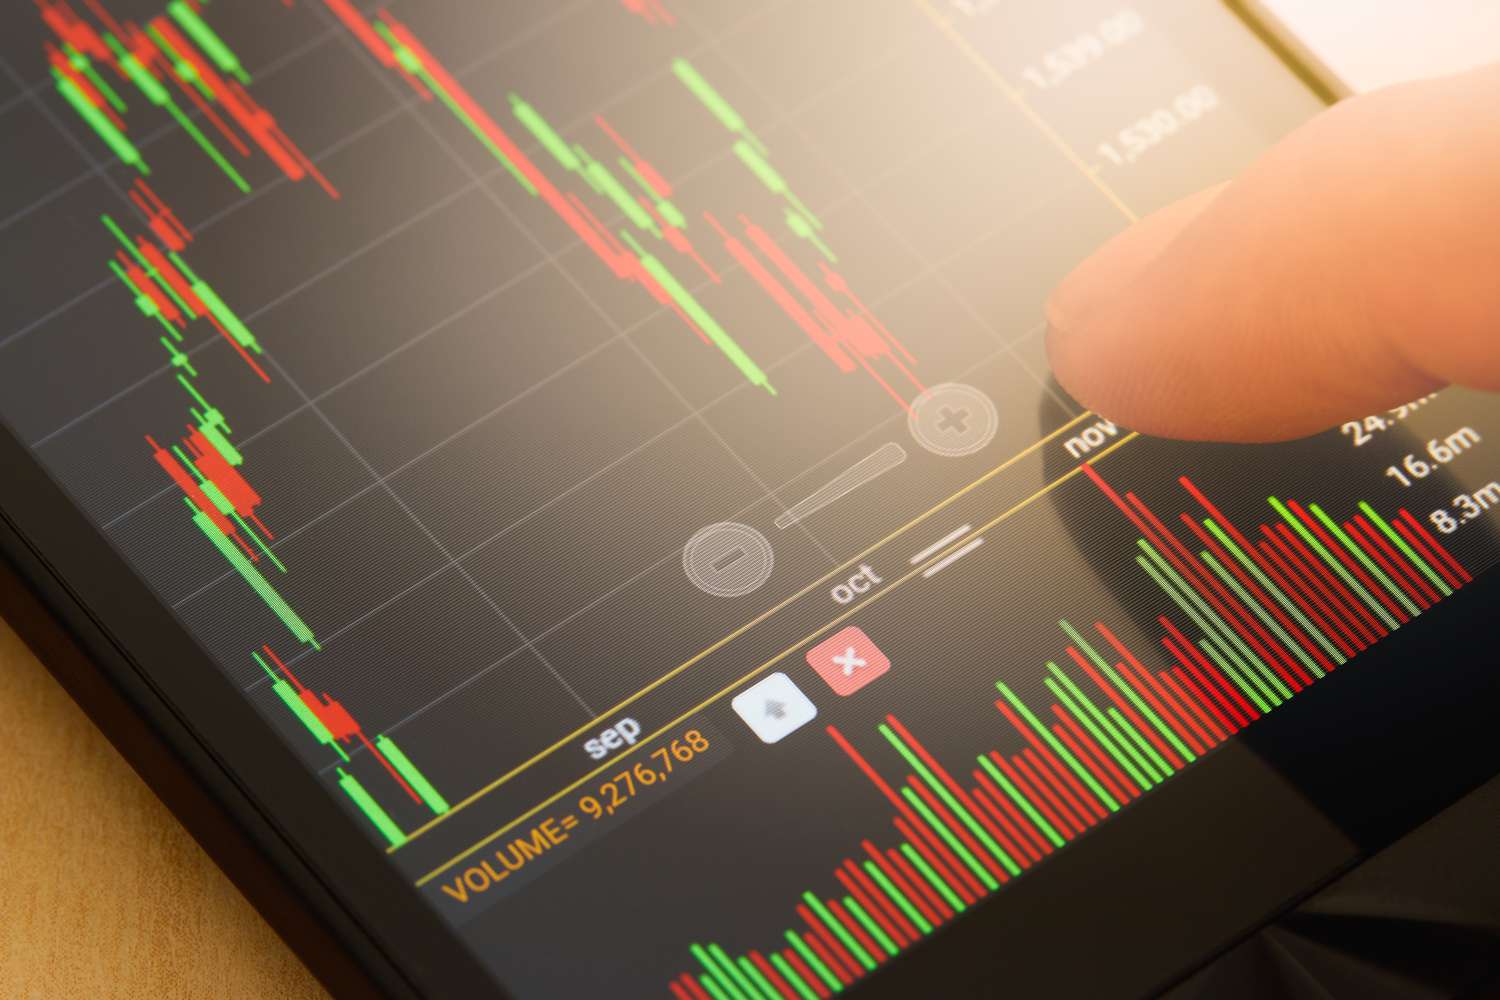
Gaining a slight edge can make all the difference between consistent profits and mounting losses in the trading environment. For many seasoned UK investors, that edge comes from mastering the use of market indicators. But it’s not about using more tools—it’s about using the right ones in the right way.
This article explores how top UK traders tactically apply technical, fundamental, and sentiment indicators to refine their strategies and stay ahead of the curve.
The Core Categories of Trading Indicators
To make sound tactical decisions, traders commonly rely on three main types of indicators: technical, fundamental, and sentiment. Let’s break down each.
Technical Indicators
These are the backbone of most short-term trading strategies. They’re derived from price and volume data and are particularly useful for timing entries and exits.
- Momentum Indicators: Help identify when an asset is overbought or oversold.
- Trend-Following Indicators: Used to confirm the strength and direction of a trend.
- Volatility Indicators: Aid in gauging market conditions and potential price breakouts.
- Volume-Based Indicators: Provide insight into the conviction behind a move.
Fundamental Indicators
Used primarily by medium- to long-term investors, these indicators assess the intrinsic value of a security based on macroeconomic data and corporate performance.
- Economic indicators: UK GDP, inflation (CPI), and Bank of England interest rate decisions.
- Company metrics: P/E ratio, revenue growth, dividend yield—particularly relevant in FTSE 100 stock selection.
Sentiment Indicators
Sentiment indicators aim to capture the mood of the market, offering clues about potential reversals or trend continuation.
- COT reports: Reveal how institutional traders are positioned.
- Retail vs Institutional Flow Analysis: Helps gauge potential herding behaviour.
- News and Social Media Sentiment Tools: Increasingly popular among UK traders looking to factor in public mood swings.
Tactical Application of Indicators by UK Traders
Professional traders rarely rely on a single indicator. Instead, they use them tactically—layering signals to build a more complete picture before making a decision.
When it comes to entry timing, many UK investors combine moving averages with momentum indicators such as the RSI. A common approach is to look for pullbacks within an existing uptrend. For instance, if the 50-day moving average is sloping upward and the RSI dips below 30, this might indicate a low-risk buying opportunity, suggesting temporary weakness within a broader bullish trend.
Exit strategies are another area where indicators play a vital role. The Average True Range (ATR), for example, helps traders set dynamic stop-losses based on recent volatility, rather than relying on fixed point values. Others might implement trailing stops that are triggered when a shorter-term moving average crosses below a longer-term one, enabling them to lock in profits while still giving the trade room to run.
Indicators also serve as essential tools for risk management. Experienced traders monitor volume, momentum, and other metrics not just for trade entries, but to assess whether to scale in or reduce exposure. A significant drop in volume or momentum, even if price action looks favourable, might prompt a reduction in position size to protect capital.
Finally, adapting to the market regime is a key tactic among professional UK traders. They often tweak their indicator settings depending on the trading environment. For example, in high-volatility conditions, Bollinger Bands might be widened to account for greater price swings. In contrast, during periods of consolidation, narrower bands help identify breakout opportunities with tighter risk parameters. This flexibility ensures their tools remain relevant across varying market conditions.
Customising and Refining Indicators
The best UK traders don’t use off-the-shelf indicators blindly—they tweak them to suit their trading style and instruments.
Asset-Specific Adjustments
Indicators behave differently across asset classes. A forex trader might rely on a 14-period RSI, while an equity trader prefers a longer-term setting to reduce noise.
Timeframe Consideration
Scalpers on the FTSE 100 often use shorter EMAs and faster RSI settings, while swing traders may favour daily charts with longer moving averages to filter out intraday noise.
Backtesting and Optimisation
Platforms like TradingView, MetaTrader, and NinjaTrader allow traders to backtest indicator-based strategies over years of historical data. This helps ensure that a setup has real-world merit, not just good luck.
Avoiding Overfitting
While optimisation is valuable, it’s easy to over-tweak an indicator to fit past data. The result? A strategy that looks great on paper but fails in live markets. Seasoned UK traders aim for a balance between adaptability and robustness.
Popular Indicators Among UK Professionals
Here are some of the most widely used indicators in the UK trading scene:
- RSI: Particularly useful for identifying mean-reversion trades on UK blue-chip stocks.
- MACD: Often used to confirm trend continuation, especially during earnings season.
- Moving Averages (50-day and 200-day): Traders look for golden cross or death cross formations on the FTSE 100 and FTSE 250.
- Economic Calendar Events: BoE policy meetings, UK employment data, and CPI releases significantly impact both forex and equity markets.
For further insight into popular trading indicators, click for details.
Conclusion
Indicators are powerful tools, but they must be used with intention, discipline, and context. Top UK investors don’t rely on flashy or complex setups. Instead, they focus on refining a core set of indicators that align with their strategy and risk profile. The real edge comes from consistent execution, clear processes, and the mental discipline to follow through.
If you’re looking to sharpen your trading edge, start by evaluating the indicators you currently use. Are they helping you make better decisions, or adding confusion? Sometimes, less is more. And as you refine your approach, you’ll find that tactical use of a few well-understood indicators can make all the difference.

